Category Archives: review EN
Elliot Wave
Dow Theory
Uptrend Continuation Candle Patterns
Reversal Chart Patterns
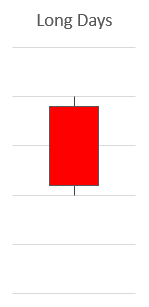
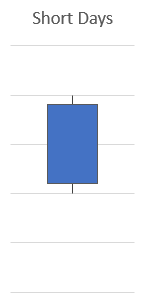
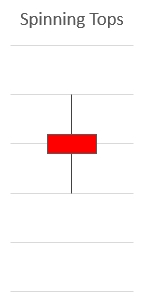
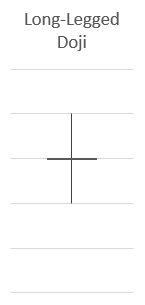
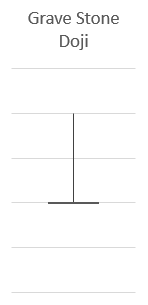
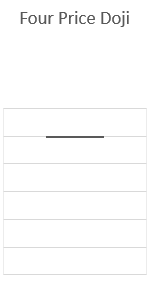
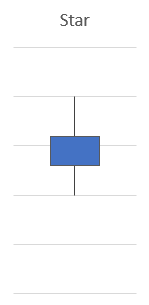
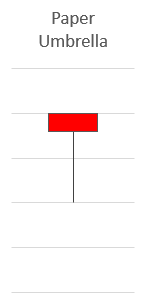
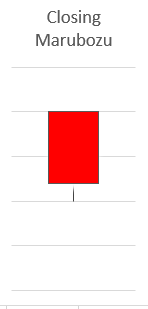
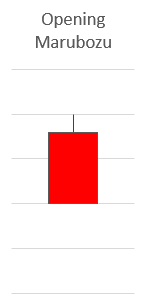
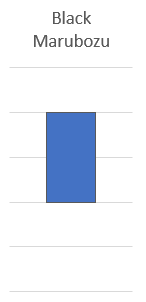
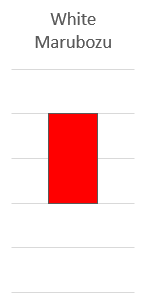
Candlestick Patterns

Technical Indicators
Trend Line
What is the Trend?
The trend is the most concept in terms of technical analysis. Many studies prove that the market moves in trend backed by trustworthy and massive data for hundreds of years.
There are 3types of the trend. The uptrend is when the previous high and previous low is increasing. The downtrend is when the previous high and previous low is decreasing. Side Trend is when the supply and demand balances, the market has no definite direction.
The trend is the fundamental phenomena that the technical indicators and systems utilise. This is because the base hypothesis of these tools is “market moves in trend”. Therefore, when the market has no clear directions, the trading strategies may not function accurately.
But, when the price moves to the sideway, up and down at a certain price range, it is also a good opportunity to use the breakthrough strategy.
What is the Trend Line?
The trend line is a tool to analyse the price movement technically. This is one of the most widely used analysing methods. Even though there are so many of the Expert advisors and trading systems are emerging, the trend line is hard to ignore!
The longer the trend consists and more attempts to maintain, the more credible the trend line is. The trend in 12monthes is more strong than the trend that lasted 3monthes. The trend that successfully sustains in 10attmepts is more credible than those who lasted for 3 attempts.
It is simply a straight line drawn on the chart. Easy to use and easy to analyse the trend of the market. However, many people do not know exactly how to draw an accurate trend line. The trend line is separated into uptrend and downtrend and classified as short, mid and long-term based on the timeframe.
How to draw a Trend Line?
It is essential to draw a trend line accurately. Every trend needs evidence, and the evidence has to be at least 2 previous lows and 2 previous highs.
uptrend
downtrend
How to use a trend line?
Uptrend
– The trend line helps you determine the low and high points of the adjustment phase and tells you when to switch trends.
– This is a temporary drop in the adjustment phase that is unavoidable in the upward trend, often touching or very close to the upward trend.
– Because the dealer intends to buy from a temporary fall in the upward trend, this trend reverses the support line used as a buying area.
DownTrend
– The falling trend line can be used as a resistance area for selling purposes.
– Unless this trend line is breached, this will determine the buying and selling areas.
-The breakthrough of the trend line is one of the fastest warnings of changing trends.
Breakthrough
When drawing a trend line, do not draw only the closing price of the day, but must include both the lowest and highest points of the day, including all-day market price movements.
– In fact, if you draw a trend line, the market price of the day may briefly deviate from the trend line. It can be the hardest for a technical analyst to judge.
-You should modify the trend line to determine whether you want to draw the trend line again or ignore it as a temporary movement for a short time.
– The best way to do this is to draw a new trend line with the existing trend line when the trend line is broken and then observe the subsequent market price movements to select one of them.
– However, once the price has crossed the trend line, it is difficult to determine whether the real trend is changing or a temporary breakthrough. So we need a standard to see if there’s been a change in the trend.
Breakthrough Strategies
1.Enter the market when you expect it to breakthrough.
In this case, since you enter your position before the breakthrough occurred, the trades’ profit rate is likely to be amazing. But, once you catch the wrong trend, it would lead to a big loss.
2. Enter when the breakthrough occurred.
this method would have a higher probability of succeed. Yet, as you enter a position when the breakout is confirmed at a higher price, the profit might be lower but more stable.
3. Enter when the retracement happens after breakthrough!
This is a more conservative way of approach to entering a position. There is a risk that the price might go higher before entering a position.
How to determine the change in trend?
1. If the closing price has crossed the trend line, it is likely that the trend has shifted.
2. If a price is being formed beyond a certain percentage, it can be seen as a trend shift. For example, if you are up or down more than 10% from last month, you can see it as a trend change.
3. If the trend line has crossed after a certain time, you can see the trend shift. For example, if you’re trading on a breakthrough line for a week or two after a breakthrough, you can see it as a trend shift.
What is the trend channel?
– Trend table is a line drawn when price movement moves within a certain interval along the trend line.
– This is a technical analysis tool used to determine if price fluctuations are formed within a certain channel (range).
– Draw a line parallel to the rising trend line in the rising phase and a line parallel to the falling trend line in the falling phase.
How to use a trend channel?
– When a trend occurs, market price movements are more likely to fluctuate between the two trends rather than break through the main and secondary trend lines formed up and down.
– Regardless of whether the trend is rising or falling, if the price is close to the main trend line at the bottom, it can be used as a buy-in, vice versa, to sell when the secondary trend line is approached.
The trend’s importance is appropriate for these short-term transactions and is easy to observe overall price and trend movements.
-Even if a trend is formed and price movements are made between the top and bottom trend lines, they eventually break through the trend. Breaking through the rising trend’s hypocrisy is a trend strengthening and new trend, and breaking through the secondary trend line is a shift in trend.
Moving Average
What is a Moving Average
– The moving average line is the most diverse and most frequently used indicator of the technology.
– This is a line that calculates the average price by dividing the variability in price by the values of the analysis period sequentially.
– A tool that identifies the direction of price fluctuation over some time through the moving average line and analyses the current price’s relevance.- The moving middle line is the most diverse and most frequently used indicator of the technology.
– This is a line that calculates the average price by dividing the variability in price by the values of the analysis period sequentially.
– A tool that identifies the direction of price fluctuation over some time through the moving average line and analyses the current price’s relevance.
A moving average is a technical indicator that shows the average price over a specific period. It is helpful for traders to indicate which direction the market is moving.
SMA(simple moving average) is an arithmetic mean of a specific number of days in the past.
The exponential moving average(EMA) is a weighted average that gives greater importance to an asset’s price on recent days.
Moving average is calculated to identify the trend direction and determine the support and resistance levels.
It is a trend following indicator as it is based on historical price.
The longer the period for the moving average, the greater the credibility it has.
How to use MA?
If the price moves above three days MA, it can be determined as short term uptrend.
While lower than 3 days can be considered a downtrend.
It can be used as cross analysis.
if 5ma crosses 20ma, it is called golden cross.
if 5ma crosses 20ma downward, it is named dead cross.
Features of MA
1. Compressing the changes in trends to a single value makes it easy to see the changes in the moving averages. The moving averages are sensitive to changes in prices, allowing you to predict price movements with relative leeway over anticipating future trends.
2. If the moving average line is calculated in the short term and sensitive to the movement of market prices, it can inform you of a change in trend early, but it can be inaccurate.
6ways to analyse market with ma
1. Directional analysis
The directional analysis is a method of analysing whether each moving average line is rising or falling. Usually, the upward direction is shifted from 5th to 20th to 60th to 120th, and even in the downward trend, the downward trend begins in the order of the long-term moving average line in the short term.
2. Array Chart Analysis
It is used a lot to analyse the regular and reverse arrays. A flat display refers to a condition in which the current price is arranged from top to bottom in the short-term, long-term moving average line, and a reverse arrangement is an opposite.
3. Support Line Analysis
When prices rise, the long-term moving average will increase to the support line in the short-term, but when the decline reverses, the moving average will fall to par. Based on this, the characteristics of long-term moving averages in the short term can be identified and used to prevent temporary deception and increase returns.3. Support Line Analysis
4. Resistance Line Analysis
When prices are falling, the long-term moving average line becomes a resistance line in turn, and when prices drop or turn around, the price rises by pushing each moving average up to one by one. This analysis is called resistance line analysis.
5. Cross Analysis
Cross analysis has a golden cross where the short-term moving average line breaks the long-term moving middle line up from the bottom to top and a dead cross where the short-term moving average line breaks the long-term moving average down from top to bottom.
6. Density Analysis
It is a method of analysing and trading long-term, short-term moving averages through distance and density separated from each other. Through the process of circulating rise and fall as concentrated or dispersed. The farther away from the moving average line spacing is, the more existing trends continue and the closer the distance between them begins to narrow, signalling closer the trend shift.
Trading Strategies using MA
Granville’s Eight Laws
he moving average and rises again without a downward break; it can be interpreted that the price is falling, but the average line is serving as a support line for the price decline. Therefore, it can be a buying signal when the price approaches the moving average line.
4. The price below the moving average is approaching the moving average again. If the moving average line is far from the price, it means that there is a high possibility of getting close again. This is a buying signal using the tendency of prices to swing to the moving average.
——————————————————————————————–
the four laws of sale
1. This is an important selling sign when the moving average rises and then finally turns downward and the share price breaks through the moving average from top to bottom.
2. If the moving average line is falling, and the price has risen above and above the moving average, it can be interpreted as a selling signal.
3. If the price has risen below the moving average to the moving average, but has not been reflected on the moving average and has shifted back to a decline just before breaking through, this is a selling sign.
4. Even if the moving average is rising, if the stock price is far from the moving average, it is more likely to fall autonomously towards the moving average, which can be interpreted as a selling sign.
Cross-analysis
golden cross
According to Wall Street technical analysts, Golden Cross and Dead Cross were created in Japan, and the upward breakthrough is sometimes called a pessimistic cross for an optimistic cross.
– Gold Cross refers to when the short-term moving average meets the long-term moving average line from the bottom up. Generally, this moment is interpreted as a strong buying signal.
– If the short-term moving average breaks through the long-term moving average, the short-term moving average should rise. This means that the price is good in the short term. Gold Cross is considered a buying signal on the premise that the short-term upward trend continues.
– Attention should be paid to changes in volume. The increase in trading volume is a strong buying signal. A strong buying signal means that the Golden Cross and Dead Cross are likely to eventually turn into a bullish market – which, according to Wall Street technical analysts, is also called a pessimistic cross for the optimistic cross.
dead cross
– Death Cross refers to a short-term moving average line breaking through the long-term moving average line from top to bottom. That is, the short-term moving average is falling.
– Dead Cross is seen as a sign of a turnaround to a bearish market on the premise that short-term trends will continue. If you look at the volume trend at the dead cross, you’ll see a general decrease.
Beware!
1. As noted earlier, gold crosses are generally interpreted as a turn signal for bullish markets. However, unlike the usual theory, it is common for prices to fall after a gold cross. This is a reaction to a short-term rise.
2. This is because there is a boundary sale that is conscious of the price increase in a short period of time. Also, there will be profit-taking sales aimed at profit-taking as much as the price has risen. Therefore, short-term fluctuations often occur.
3. Therefore, it should be noted that the golden cross in the bear market could be a selling signal. In conclusion, we need to know that there are real and fake things in this cross-analysis.
Disparity
Disparity = (End price/n day moving average) X100
– Separation refers to the gap between the price and the moving average line. This is the rate of separation that determines how far the price is from the moving average line.
– You divide the price by the moving average line and display it as a percentage, and if the gap exceeds 100 per cent, the price is higher than the average line and below 100 per cent below the moving average line.
– Typically, the 20-day moving average is frequently separated, and the selling signal is displayed at 5% up and down based on 100. If the 20th-day gap is more than 105%, it is considered a selling signal, and vice versa, 95% below a buying signal. The 60-day gap can be seen as the point of sale when the floor and the floor change more than 10%. If it exceeds 110%, it becomes a sell-off, and below 90%, it becomes a buy-out 4 signal. The 120-day gap is a selling and buying signal at 115% and 85% respectively based on 15% above and below.
GE is reversed for a considerable period of time, and the short-term moving average no longer falls and starts to rise, this is when the bottom line is expected.
Investment Strategies in the New Rise
1. This is a buying signal if the short-term moving average line rapidly rises above the central long-term moving average.
2. If the price from above is in the order of the short-term mid-and long-term lines and is rising side by side, it is in the upward phase.
3. After a long-term moving average line has been in constant alignment for a considerable period of time; the short-term moving average line is no longer rising. It is expected to be at a short-term high point when it weakens.
4. If the long-term moving averages are concentrated and intertwined, the direction of the market is unclear, so it is advisable to delay the purchase by one notch.